This is the second part of my dive into Reveal's diversity data of silicon valley companies. They have an ongoing investigation, Hidden figures: How Silicon Valley keeps diversity data secret. You can also view my first article where I examined gender data.
For this article I examined the racial makeup of silicon valley companies. Only 11% of companies contacted by Reveal responded to diversity data inquiries, so I am only examining the data of the 22 companies who have participated so far.
Source: https://public.tableau.com/shared/JPNR3T879?:display_count=yes
![]()
Note: This Tableau study cannot be embedded, please use the link to see the data on the three sheets.
Summary statistics
Time to go deeper with Excel for some stats analysis.
The following table is calculated by finding the difference from actual representation to what we might expect from the general US population.
I found the information from the US Census bureau using their 2016 projection based on the 2010 census. Here is the source.
There are some important notes to make when analyzing census information and all the calculations I create using them. The U.S. does not recognize Latino or Hispanic as a race, instead they require Hispanics to identify as one of the other races. The census only differentiates between those of Hispanic origin or culture with those who aren't, in one race, White. So while White alone is estimated at 76.9%, White not Hispanic is estimated at 61.3%. This suggests 15.6% of Whites in America are of Hispanic origin or culture. Meaning about 2.2% of the population is Hispanic and does not consider themselves White. Rather than try to guess which categories they place themselves in, I've simply gone with a higher total percentage to compare to (102.2), and then I analyze my data with a margin of 3%. This way even if every non-white Hispanic identifies as one other race, my findings on over or under representation will still be correct.
--
These are the findings of the U.S. census for the demographics of America, with my adjustments.
| % | American Indian or Alaskan Native | Asian | African-American or Black | Latino or Hispanic | Hawaiian Native or Pacific Islander | Two or more races | White non-Hispanic |
|---|---|---|---|---|---|---|---|
| Percentage | 1.3% | 5.7% | 13.3% | 17.8% | .2% | 2.6% | 61.3% |
If you've looked through the Tableau exploration above, then you should know how different silicon valley tends to be. So I decided to evaluate just how different it is from the general US population.
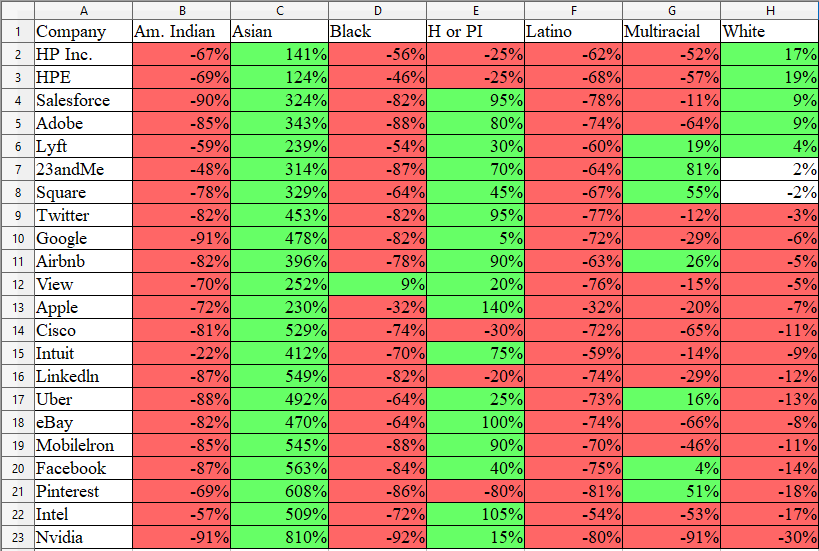
This table finds the percentage change between silicon valley and what we could expect using US percentages for those same races. I only shade differences less than or greater than 3%. Differences greater than 3% are shaded green indicating representation above what we could expect from the US population. Red shading indicates it is lower than expected.
1

In the first pass we can note the smaller proportioned categories Am. Indian, Pacific Islander, Multiracial. Their share of the total U.S. population is less than 4.1% total. Meaning even a company with thousands of employees might have their numbers skewed by a few in those categories. We can note however that they're underrepresented except for Hawaiians or Pacific Islanders. Reveal in their investigation discovered one company was miscategorizing Asians as Hawaiian or Pacific Islander, and only a few could swing the representation dramatically. However due to the power of small numbers here, I'll note Apple and Intel might bear a second look for possible miscategorization (and possibly 23andMe for Multiracial), but I'll go ahead and remove these categories and focus on the larger races which should have stronger statistical value.
2

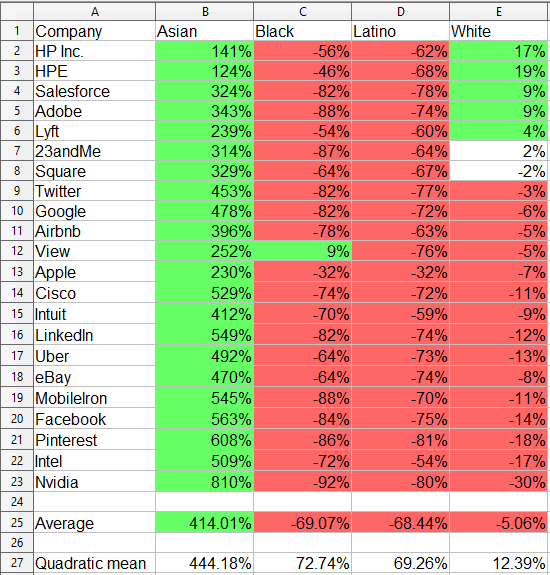
Now we're down to the largest three races and Latino ethnicity recognized by the U.S. census. You can observe Latinos are underrepresented at every company, but Blacks are more heavily underrepresented with View being an exception. Whites are overrepresented at five companies but underrepresented at most companies. In the Tableau study you saw Asians make up a large percentage of silicon valley companies and are the majority of employees at Nvidia and eBay. When compared to their relatively small percentage of the U.S. population (5.7%), it's now clear just how dramatic their representation is.
The averages show Asians are 414% overrepresented in silicon valley today and are the only race not currently underrepresented. (Current for 2016.)
Observations
If you remember from analysis of my previous article on gender diversity in Silicon Valley, Nvidia and View sat in the bottom two for female percentage of popular roles like Executives, Managers and Professionals. They are also remarkable here for separate reasons, View is the only company to employ a relatively high percentage of Black employees and Nvidia is the highest percentage employer of Asians.
One final observation, I was at first surprised by Apple's relatively high employment of Black and Latino employees. Far higher than the rest of Silicon Valley. However after some research and some filtering of the data (which you can perform for yourself in the Tableau), it's now apparent Apple is including their store employees, to the extent that they employ 3,822 Latino sales workers as well as 2,624 Black technicians. When only examining Executive, Managerial and Professional roles they fall to the industry average.
Looking forward I hope I contributed to the best of my ability in analyzing this new data, and I encourage anyone who comes to different results to contact me. These are only the industry numbers that I have now. Many large companies like Netflix, Amazon, Oracle have so far not contributed to Reveal's investigation.
Comments
There are no comments yet.